


W. Savindu Pasan Botheju, Keyur B. Shah, Mohammed Makkiya
Pauley Heart Center, Department of Cardiology, Virginia Commonwealth University, Richmond, Virginia
Clinical History:
A 66-year-old female with a past medical history of mitral valve prolapse, premature ventricular contractions, gastroesophageal reflux disease and migraines presented to the Emergency Department with a two-day history of progressive mid-sternal chest pain radiating to the left chest. The pain was initially sharp before transitioning to a pressure-like sensation with a 10/10 intensity that did not response to antacids or aspirin and was unrelated to physical exertion or changes in body position. She had been experiencing high levels of stress at her workplace in the weeks leading up to the admission.
On physical examination, she was in moderate distress with a blood pressure of 136/85 mmHg, pulse rate of 105 beats per minute. An electrocardiogram (ECG) revealed sinus tachycardia (Figure 1, left) with ventricular bigeminy and diffuse T wave inversions. Initial laboratory results were within the normal range except for increased serum concentrations of troponin 0.20 ng/mL (normal ≤ 0.19 ng/mL) , N-terminal-pro B-type natriuretic peptide level 2528 pg/mL (normal 0 – 124 pg/mL) and C-Reactive protein 1.3mg/dL (normal 0 – 0.5 mg/dL). A transthoracic echocardiogram revealed mild concentric left ventricular hypertrophy with apical akinesis and reduced systolic function. Telemetry revealed frequent ventricular ectopy including brief episodes of non-sustained ventricular tachycardia. She was treated for suspected acute coronary syndrome with high dose aspirin and intravenous anticoagulation and underwent emergent invasive coronary angiography which revealed no obstructive coronary disease.
A cardiac magnetic resonance imaging (CMR) scan was performed (see following section for details) on a 3T Siemens Magneton Vida MRI scanner and revealed findings suggestive of stress cardiomyopathy with some areas of delayed gadolinium enhancement. She was initiated on guideline directed medical therapy for heart failure with a reduced ejection fraction and fitted with a wearable cardioverter defibrillator for primary prevention of ventricular arrhythmias. A repeat CMR performed three weeks later showed a recovery in systolic function and improvement in the areas of delayed gadolinium enhancement and myocardial edema. However, there was a newly developed hypertrophy isolated to the left ventricular apex phenotypically consistent with apical variants of hypertrophic cardiomyopathy. Compared to the prior, a repeat ECG revealed more pronounced, deep inverted T waves in the precordial leads (Figure 1, right). A third cardiac MRI performed four months after the first scan, showed completed resolution of all abnormal findings including the apical hypertrophy that was noted in subacute period. She has had no signs of recurring cardiomyopathy so far on outpatient follow-up and the current plan is to eventually wean her off guideline directed medical therapy.
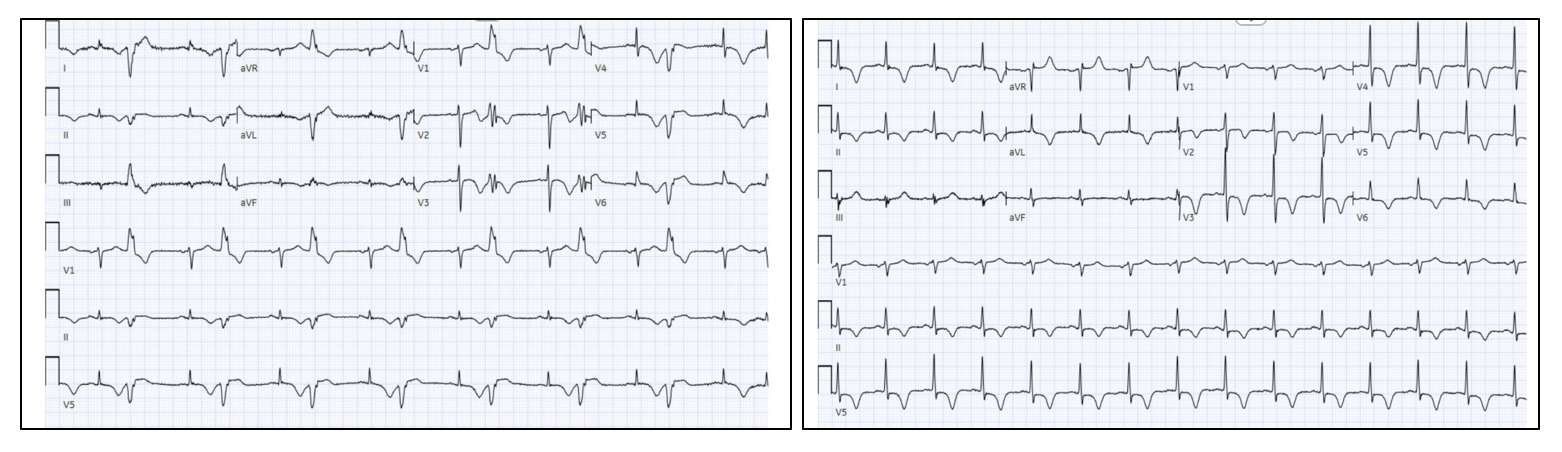
Figure 1. (Left panel) Initial electrocardiogram (ECG) on admission with stress CM, revealing sinus rhythm with ventricular bigeminy. (Right panel) The ECG three weeks later during clinic follow-up showing diffuse, deeper inverted T waves on multiple leads.
CMR Findings:
The initial MRI revealed a left ventricle (LV) with normal thickness and mildly increased LV volumes. Steady-state free-precession (SSFP) cine sequences showed mid to distal akinesis of the LV segments with apical ballooning (Movie 1). The overall LV systolic function was reduced with a calculated ejection fraction of 37%. The left atrium was dilated. The right ventricle (RV) had normal wall thickness and volumes with preserved systolic function and a calculated ejection fraction of 56%. Late gadolinium enhancement (LGE) imaging showed diffuse, patchy enhancements along the mid and distal LV segments sparing the basal segments (Figure 2). There was also involvement in the mid to distal epicardial inferior, inferoseptal and inferolateral walls. T1 times were elevated in the corresponding territories supporting an ongoing inflammatory process (Figure 3). On native T2 mapping, there was mid to distal diffuse elevation of T2 times suggestive of myocardial edema (Figure 3).

Movie 1. SSFP cine sequences on initial CMR showing mid to distal akinesis of the left ventricle along with apical ballooning. (Left) 2-chamber, (Middle) 3-chamber and (Right) 4-chamber views respectively.
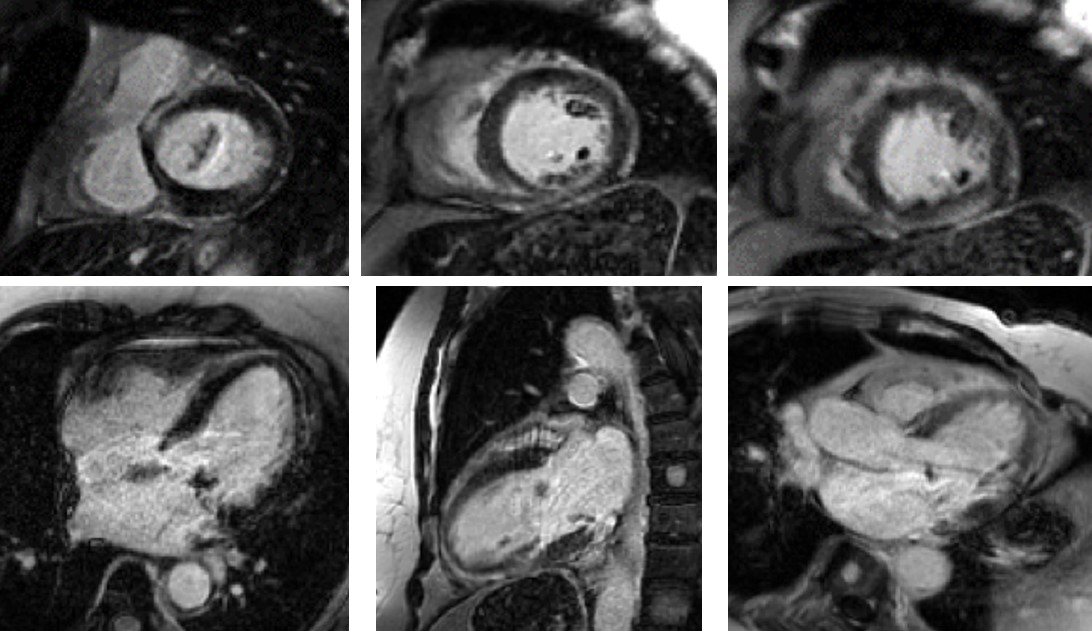
Figure 2. Areas of abnormal LGE on the initial CMR, primarily in the mid and distal LV segments. Top panel, apical to mid to basal from left to right. Bottom left – 4 chamber; bottom center – 2 chamber; bottom right – 3 chamber. LGE sequence – GRE PSIR.

Figure 3. Elevated T1 times (Top), T2 times (Middle) and T2-STIR (Bottom) mapping images in the short axis view on the initial CMR, apical to mid to base from left to right.
hree weeks later, a repeat cardiac MRI on the same 3T Siemens Magneton Vida MRI scanner revealed an improvement in LV systolic function with a calculated LV ejection fraction of 60%. On the SSFP cine sequences, the previously seen apical akinesis and ballooning had now resolved (Movie 2). Interestingly, the apical myocardium had now increased in thickness with a maximal end-diastolic diameter of 1.6 cm, resembling a new case of phenotypic apical hypertrophic cardiomyopathy (Movie 2). There was ongoing patchy delayed enhancement in the previously afflicted areas, although it appeared improved compared to the initial scan.


Movie 2. SSFP cine sequence on the second CMR showing localized apical hypertrophy (maximum end-diastolic diameter of 1.6cm) and normalized LV systolic function without wall motion abnormalities. (Left) 2-chamber, (Middle) 3-chamber and (Right) 4-chamber views respectively.
A third cardiac MRI again on the same 3T Siemens Magneton Vida MRI scanner performed four months after the first scan, revealed that the thickened apical segments had resolved and the apical wall thickness had returned back to normal (Movie 3) . The previously observed areas of delayed gadolinium enhancement were no longer present, and the myocardium was now devoid of any areas of LGE (Figure 4). Additionally, the native T1 and T2 mapping values were all normal as well ( Figure 5). Notably, the calculated scar burdens were 17%, 8% and 0% from the initial to final scans, respectively.


Movie 3 SSFP cine images on the third CMR showing resolution of previously seen hypertrophy with a return to normal wall thickness along with normal LV systolic function. (Left) 2-chamber, (Middle) 3-chamber and (Right) 4-chamber views, respectively.
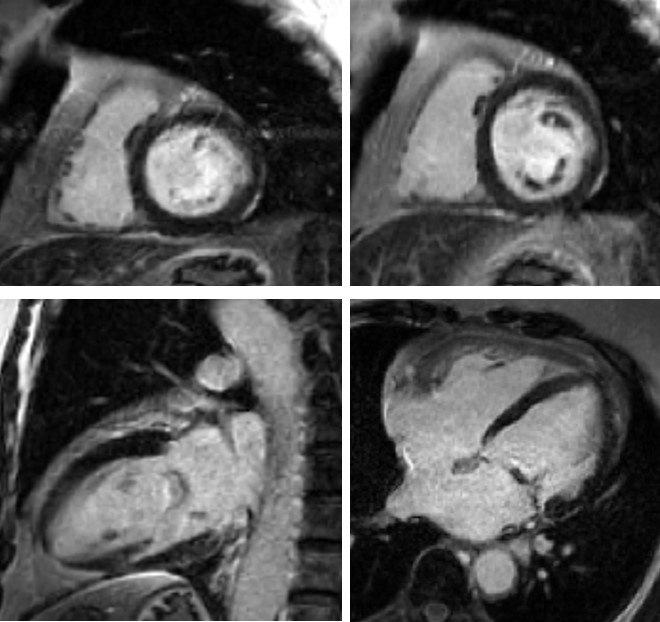
Figure 4. LGE images from the third CMR showing no delayed enhancement and normal myocardium (top left – basal short axis; top right – mid short axis; bottom left – 2 chamber; bottom right – 4 chamber). LGE sequence – GRE PSIR.

Figure 5. Normalization of T1 times (Top), T2 times (Middle) and T2-STIR (Bottom) mapping images in the short axis view on the third CMR, apical to mid to base from left to right.
Conclusion:
This case of stress cardiomyopathy (stress CM) illustrates a phenomenon of transient inflammation and edema followed by dynamic hypertrophy over the area of apical ballooning that eventually resolved over time. While acute systolic heart failure is the most common complication of stress CM, what stood out to us was the transient cardiac remodeling and apical hypertrophy noted in the subacute phase of this case and is a phenomenon that has only been described in a handful of case reports.[1-4]
Perspective
Prior case reports suggest that this reversible hypertrophy could be to the result of ongoing myocardial inflammation and edema, resulting in a pseudohypertrophy presentation that resolves with time as the edema subsides. Additionally, there has been variable data in terms of whether the resolution of imaging findings with abnormal signaling correlates with the return of myocardial function to baseline or whether there could be a lag in normalization of myocardial edema, which is what was observed in this case. Therefore, a prolonged course of ongoing myocardial edema despite normal LV wall motion could explain these transient changes in myocardial thickness: however, it is currently unknown whether this is a clinically significant finding. The majority of imaging on patients with stress cardiomyopathy is typically performed in the acute phase and on follow up after a certain period, but not so much in the sub-acute period, and hence there is a scarcity of available data to better understand this phenomenon.
The “neurocardiogenic link”, which is one of the proposed pathophysiologic mechanisms underlying stress cardiomyopathy, is an additional theory that could explain the transient hypertrophy. It is believed that the increase in catecholamines and stress-related neuropeptides contributes via multiple mechanisms such as microvascular vasoconstriction, supply-demand mismatch, increased cardiac afterload, and direct catecholamine toxicity. It is unclear, however, how this mechanistically translates to the apical form of hypertrophy observed in this case. It may be explained by localized differences in the expression of ß-1 and ß-2 adrenoreceptors in the myocardial tissue, which have been reflected in experimental studies.[5-7]
In conclusion, transient hypertrophy of the affected ventricular segments in stress cardiomyopathy is a rare occurrence and given the paucity of evidence based data on the evolution of these changes, its cause and clinical significance remain yet to be determined. More evidence in the form of larger scale studies with serial imaging done in the subacute phase could potentially help define this dynamic process further.
Click below to view the entire case on CloudCMR:
CMR1: https://www.cloudcmr.com/8657-1973-1968-0169/
CMR2: https://www.cloudcmr.com/1457-1973-2298-0177/
CMR3: https://www.cloudcmr.com/5757-1973-5918-0176/
References:
- Kato T, Ban Y, Kuruma S, et al. Two cases of reversible left ventricular hypertrophy during recovery from takotsubo cardiomyopathy. Echocardiography. 2013;30(4). doi:10.1111/ECHO.12139
- Hwang HJ, Lee HM, Yang IH, Kim DH, Byun JK, Sohn IS. Evolutionary Change Mimicking Apical Hypertrophic Cardiomyopathy in a Patient with Takotsubo Cardiomyopathy. Echocardiography. 2014;31(10):E293-E295. doi:10.1111/ECHO.12722
- Williams MGL, Liang K, Bucciarelli-Ducci C. Transient recurrent takotsubo cardiomyopathy mimicking apical hypertrophic cardiomyopathy. Eur Hear journal Cardiovasc Imaging. 2021;22(6):E72. doi:10.1093/EHJCI/JEAA274
- Izgi C, Ray S, Nyktari E, et al. Myocardial edema in Takotsubo syndrome mimicking apical hypertrophic cardiomyopathy: An insight into diagnosis by cardiovascular magnetic resonance. Heart Lung. 2015;44(6):481-485. doi:10.1016/J.HRTLNG.2015.07.008
- Paur H, Wright PT, Sikkel MB, et al. High Levels of Circulating Epinephrine Trigger Apical Cardiodepression in a β2-Adrenoceptor/Gi-Dependent Manner: A New Model of Takotsubo Cardiomyopathy. Circulation. 2012;126(6):697. doi:10.1161/CIRCULATIONAHA.112.111591
- Ancona F, Bertoldi LF, Ruggieri F, et al. EHJ BRIEF COMMUNICATION Takotsubo cardiomyopathy and neurogenic stunned myocardium: similar albeit different. doi:10.1093/eurheartj/ehw035
- Pelliccia F, Kaski JC, Crea F, Camici PG. Pathophysiology of Takotsubo Syndrome. Circulation. 2017;135(24):2426-2441. doi:10.1161/CIRCULATIONAHA.116.027121
Case prepared by:
Eddie Hulten, MD, MPH, FACC, FACP, FSCMR, FSCCT, FASNC
Lifespan Cardiovascular Institute, Rhode Island, the Miriam and Newport Hospitals
Warren Alpert Medical School, Brown University
Uniformed Services University, Bethesda, MD

