


Dr. Hisham Ahamed1, Dr. Rajesh Kannan2, Ms. Chris Ann Joji1
1Department of Cardiology, Amrita Institute of Medical Sciences, Kochi, Kerala, India
2Department of Cardiac Radiology, Amrita Institute of Medical Sciences and Research, Kochi, Kerala, India
Clinical History
A 46-year-old normo-tensive man was referred to the cardiology clinic with a history of progressive breathlessness and multiple episodes of syncope over a 5-month period. His medical history included hypothyroidism for which he was on regular thyroxine supplements and obesity. The patient’s mother had succumbed to a cardiac arrest at 52 years of age and his elder brother (hypertrophic cardiomyopathy, HCM phenotype) had received a permanent pacemaker (dual chamber) for symptomatic complete heart block at 49 years of age. The patient’s medications included furosemide and thyroxine. General physical examination was unremarkable except for a few scattered angiokeratomas over the trunk region. Cardiovascular examination revealed the presence of cardiomegaly.
His electrocardiogram (ECG) (Figure 1) revealed sinus rhythm, right bundle branch block (RBBB) pattern, Q in I, aVL,V4-V6, ST elevation in V4-V6, T inversions in I,aVL,V2-V6, voltage criteria for left ventricular hypertrophy (LVH).

Figure 1. Baseline electrocardiogram – Normal sinus rhythm, PR interval of 140 msec, left axis deviation, RBBB pattern, Q in I, aVL, V4-V6, ST elevation in V4-V6, T inversions in I, aVL, V2-V6, voltage criteria for left ventricular hypertrophy(LVH), left atrial enlargement, and intraventricular conduction defect (QRSd – 192 msec).
A transthoracic echocardiogram (Video 1) showed a dilated left ventricle and left atrium, severe concentric left ventricular hypertrophy (end diastolic septal thickness – 30 mm) along with right ventricular hypertrophy (RV free wall thickness 7 mm), akinesia and thinning of the apical interventricular septum, apex, mid and apical antero-lateral and infero-lateral segments with severely depressed LV systolic function (LVEF – 34%). There was no evidence of left ventricular outflow tract (LVOT) or mid-cavity obstruction. There was suspicion of a left ventricular apical clot. There was severe impairment of the left ventricular longitudinal systolic function (Septal s’ = 4.0cm/sec (normal range 8.0+/-1.2cm/s), Lateral s’ = 4.0cm/sec (normal range 8.8+/-1.8cm/sec), grade II diastolic dysfunction and 2D speckle tracking showed a severe reduction in the left ventricular global longitudinal strain (- 6.0, normal range -21.7+/-2.5).The right ventricular systolic function was preserved (RV Basal TDI 11.0cm/sec (normal range 14.1+/-2.3cm/sec); TAPSE 19 mm (normal range 24+/-3.5mm)) and the estimated pulmonary artery systolic pressure was 38 mmHg.

Video 1. Transthoracic Echocardiogram (Apical 4 chamber). Dilated left ventricle and left atrium, severe biventricular hypertrophy, akinesia, and thinning of the apical interventricular septum, apex, mid and apical anterolateral and infero-lateral segments with severe LV systolic function (Left ventricular ejection fraction, LVEF – 34%). The left ventricular global longitudinal systolic strain was severely impaired (GLS- 6.0).
His coronary angiogram revealed normal epicardial coronary arteries. A 72 hour ambulatory ECG monitoring revealed the presence of intermittent complete heart block. He was referred for a cardiac MRI to further investigate his marked LV hypertrophy phenotype and suspected LV apical thrombus.
CMR Findings
The study was performed on the 3.0T system (Siemens Biograph mMR) during sinus rhythm of 64 beats per minute. CMR cine imaging (SSFP) in two chamber, three chambers, four chamber and short axis stacks ( Video 2, Figure 2) showed severe concentric left ventricular hypertrophy with an end diastolic septal thickness of 31 mm and right ventricular hypertrophy (RV free wall thickness 7 mm).

Video 2 . Cardiac MRI (SSFP cine four-chamber view). Severe concentric LVH with an end-diastolic septal thickness of 31 mm and right ventricular hypertrophy (RV free wall thickness 7 mm). Myocardial thinning and akinesia of the apical interventricular septum, mid and apical anterolateral, anterior, and inferolateral segments, along with a thinned out and dyskinetic and aneurysmal LV apex (LVEF – 28%). A 20 x 19 mm clot was noted in the aneurysmal dyskinetic left ventricular apical segment. LGE imaging showed extensive mid-myocardial to trans-mural scar involving the inferolateral wall as well as the anterior and inferior walls, with a scar burden of approximately 25% of the total left ventricular mass.

Figure 2. Cardiac MRI (SSFP 4 chamber view)- Severe concentric LVH with an end-diastolic septal thickness of 31 mm and right ventricular hypertrophy (RV free wall thickness 7 mm). Myocardial thinning and akinesia of the apical interventricular septum, mid and apical anterolateral, anterior, and inferolateral segments, along with a thinned out and dyskinetic and aneurysmal LV apex (LVEF – 28%). A 20 x 19 mm clot was noted in the aneurysmal dyskinetic left ventricular apical segment. LGE imaging showed extensive mid-myocardial to trans-mural scar involving the inferolateral wall as well as the anterior and inferior walls, with a scar burden of approximately 25% of the total left ventricular mass.
There was myocardial thinning and akinesia of the apical interventricular septum, mid and apical antero-lateral, anterior and inferolateral segments. The left ventricular apex was noted to be dyskinetic and thinned out. The left ventricular systolic function was severely impaired (LVEF 28%) with a marked reduction in the left ventricular longitudinal systolic function, while the RV systolic function was preserved. A 20 x 19 mm clot was noted in the dyskinetic left ventricular apical segment. Mild hyper- trabeculation was noted in the basal and mid anterolateral segments of the left ventricle.
Late gadolinium enhancement imaging (LGE)(PSIR with appropriate TI) done after 10 minutes in two chamber and short axis showed extensive mid-myocardial to trans-mural scar involving the infero-lateral wall as well as the anterior and inferior walls, with a scar burden of approximately 25% of the total left ventricular mass (Figure 3, 4, 5).
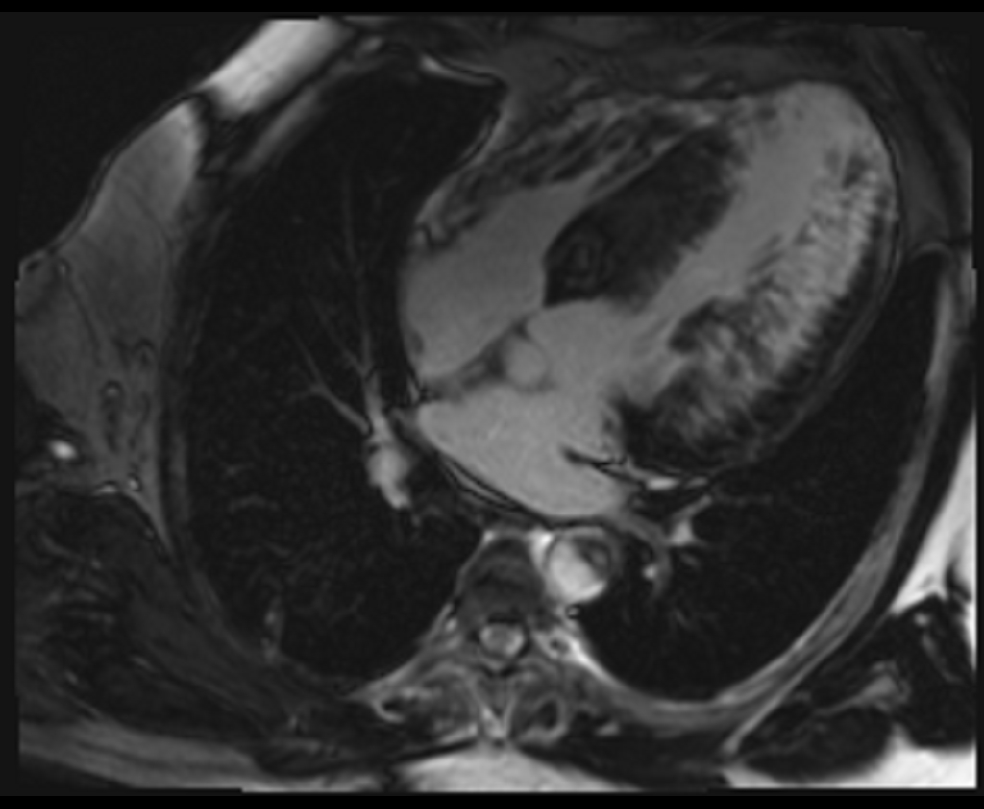
Figure 3. Late gadolinium enhancement (four chamber view)- PSIR with appropriate TI done after 10 minutes, extensive mid-myocardial to trans-mural scar involving the inferolateral wall as well as the anterior and inferior walls.
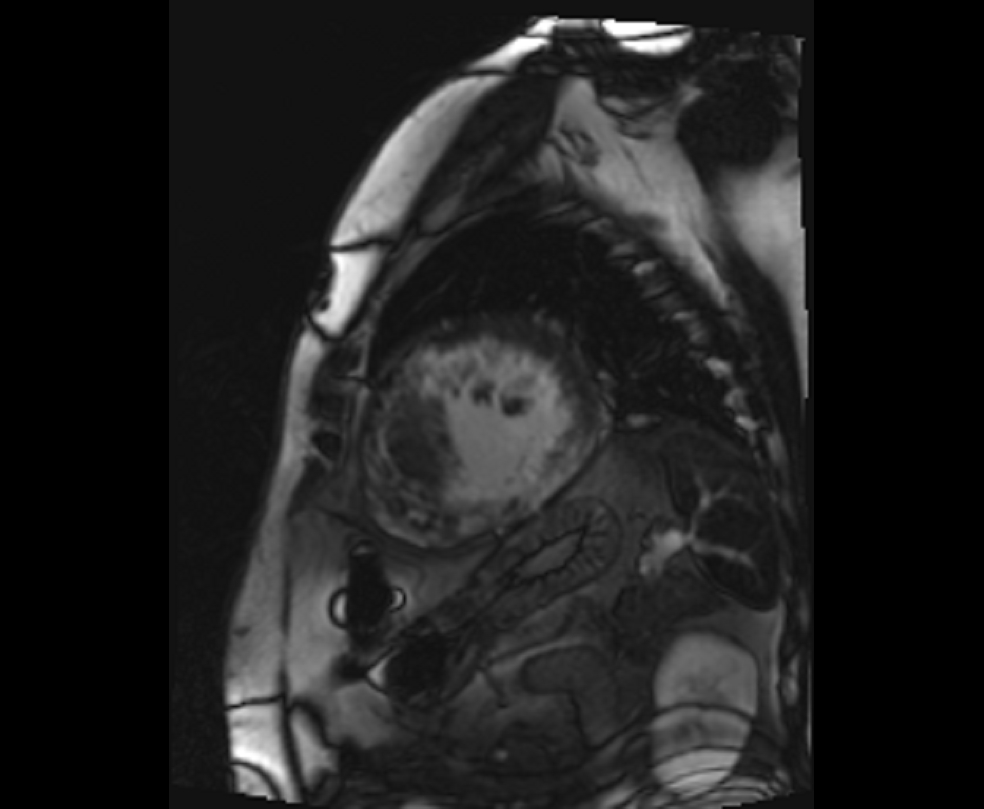
Figure 4. Late gadolinium enhancement (short axis- mid-ventricular level)- Extensive mid-myocardial to transmural scar involving the inferolateral, inferior, inferoseptal, anterior, and anterolateral segments.

Figure 5. Late gadolinium enhancement (Two-chamber view with TI 600 msec)- A non-enhancing left ventricular apical thrombus. The mass appeared homogeneously black on all post-contrast sequences, including perfusion, Vibe Dixon, and PSIR sequence with 600 ms TI time.
A non-enhancing left ventricular apical thrombus was seen in the 2-chamber view (Figure 5). The mass appeared completely dark (homogenously black) on all post-contrast sequences, including perfusion, Vibe Dixon, and PSIR sequence with 600msec TI time. TI time was set at 600msec to selectively null avascular tissues such as thrombus. It was not covered in Myomap sequences.
Multiparametric mapping revealed that the non-scarred myocardial segments showed low native T1 values (up to 1050 msec, normal range 1205+/-39msec Figure 6) and markedly elevated native T1 values in the scarred myocardial segments (up to 1540 msec, Figure 7).
T2 maps demonstrated pockets of elevated T2 values (Figure 8) predominantly in the scarred myocardial segments (up to 68 msec, normal range 40+/-4msec).

Figure 6. Multi Parametric mapping. Non-scarred myocardial segments showed low native T1 values (up to 1050 msec).

Figure 7. Multi Parametric mapping- Markedly elevated native T1 values in the scarred myocardial segments (up to 1540 msec).
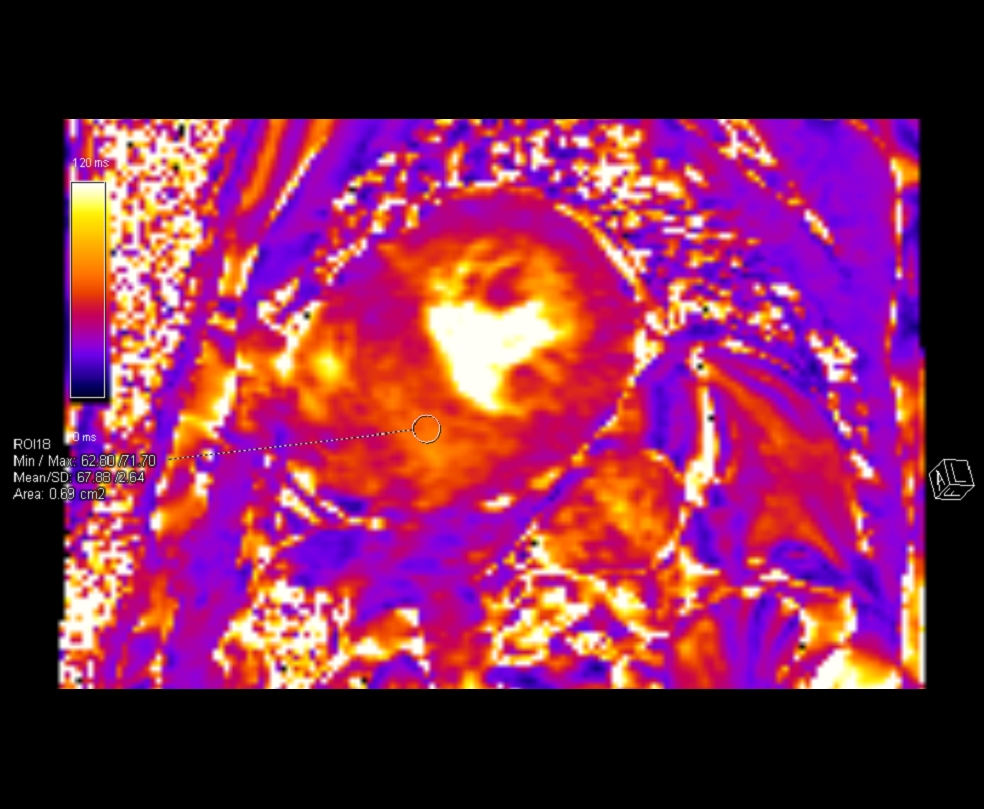
Figure 8. Multi Parametric mapping. T2 maps demonstrated pockets of elevated T2 values predominantly in the scarred myocardial segments (up to 68 msec).
Conclusion
This case highlights the importance of CMR in the evaluation and deep phenotyping of a patient with severe unexplained left ventricular hypertrophy and LV apical aneurysm. The presence of biventricular hypertrophy with marked left ventricular scarring and a strong familial history of a similar phenotype raised the possibility of familial hypertrophic cardiomyopathy. However, the presence of advanced conduction system disease in the proband and his sibling, a truncal distribution of angiokeratomas, and extracardiac symptoms such as severe acroparaesthesia led us to consider evaluating for HCM phenocopies as well. Multiparametric mapping by CMR revealed myocardial regions with low native T1 values. The combination of diffuse left ventricular hypertrophy with low native T1 values and the aforementioned extracardiac symptoms immediately raised the specter of Fabry cardiomyopathy. The leukocyte alpha-galactosidase A assay was confirmed to be markedly low (<1%) and a whole exome sequencing study (NGS) detected a pathogenic missense variant -c.902G>A(p.Arg301Gln) – in exon 6 of the GLA gene. Thus, a diagnosis of classic Fabry disease was established and the specific mutation identified was amenable to migalastat therapy (an oral pharmacological chaperone of alpha-Galactosidase A). Our patient was also demonstrated to have cornea verticillata and proteinuria (2+) with an estimated GFR of 86 mL/min/1.73m2. The patient’s brother who had an HCM phenotype and complete heart block was also confirmed to have Fabry disease by enzyme assay and DNA sequencing.
The patient underwent dual chamber AICD (implantable cardioverter defibrillator) implantation and was started on apixaban for LV apical clot, in addition to guideline directed medical therapy for heart failure. He continued regular migalastat therapy. After a relatively uneventful period of 3.5 years, the patient had recurrent admissions for heart failure which was foreshadowed by a steady decline in left ventricular ejection fraction (LVEF 15% in 2023). Eventually, after discussion in a multi-disciplinary meeting, the patient was listed for a cardiac transplantation and underwent the same in February 2023.
Perspective
The CMR findings in this patient with an HCM phenotype (LV hypertrophy with LV apical aneurysm) were instrumental in setting the stage for establishing the diagnosis of Fabry cardiomyopathy, an important HCM phenocopy.
Anderson – Fabry disease (AFD) is a rare X-linked lysosomal storage disorder that results from a deficiency or complete absence of the hydrolase enzyme α-galactosidase A (α-gal A).[1] This causes the intracellular accumulation of globotriaosylceramide in various organ systems, leading to multi-systemic manifestations. The estimated prevalence of AFD is between 1 in 40,000 to 1 in 117,000 individuals.[2-4] AFD commonly involves the heart, kidneys, nervous system, eyes, skin and vascular endothelium. Cardiovascular involvement in AFD is common and can lead to myocardial inflammation, myocardial fibrosis and left ventricular hypertrophy making it the leading cause of death in both men and women with AFD.[5-8]
It was in the context of the CMR multiparametric findings, that the possibility of Fabry disease was first considered in our patient. The combination of left ventricular hypertrophy and low native T1 values are a characteristic feature of Fabry cardiomyopathy due to intracellular accumulation of glycosphingolipids and appears to have reasonable sensitivity.[9] The other myocardial diseases where the native T1 values may be seen to be low are iron overload states and hydroxychloroquine mediated cardiotoxicity. Low native T1 values have also been seen in 50-60 percent Fabry disease patients in the absence of left ventricular hypertrophy.[10] The interpretation of native T1 times in Fabry disease, however, needs to be done with caution and it is dependent on the stage of the disease.[10,11] In the storage stage, there may be normal or low native T1 values, while in the inflammation and myocyte hypertrophy stage, there will be low native T1 values and elevated T2 values. The third stage characterized by fibrosis, there will be pseudo-normalization of native T1 values and extensive LGE. Our patient had both pockets of low native T1 values as well as regions of extensive LGE which led to very high native T1 values.
Integrating techniques like parametric mapping alongside thorough morphological evaluation and LGE in CMR tissue characterization offers an excellent tool to evaluate and effectively distinguish significant causes of LVH. LVH secondary to hypertensive heart disease is typically concentric, with LGE being reported in up to 50% of patients in a non-specific-subendocardial pattern. T1 mapping and ECV values are slightly increased in hypertensive patients with LVH. In cardiac amyloidosis, poor myocardial nulling and global subendocardial LGE with a “tramline” pattern are often noted, while parametric T1 mapping shows markedly elevated native T1 values much higher than other hypertrophic disease phenotypes. In addition, cardiac amyloidosis typically has the highest extracellular volume (ECV) of all cardiomyopathies. In HCM, along with asymmetric LVH, LGE sequences may demonstrate focal enhancement at the RV insertion points along with diffuse patchy mid-wall enhancement in areas of hypertrophy, while parametric T1 mapping may show elevated native T1 values in the hypertrophied as well as the non-hypertrophied segments.
Although concentric LVH has been widely described in Fabry disease, left ventricular apical aneurysm (LVAA) has been a novel and rare phenotype of Fabry cardiomyopathy which has been increasingly documented. This LVAA phenotype can potentially mimic patients with apical HCM and HCM with mid-ventricular obstruction with LVAA. A recent study by Yu et al showed that the LVAA phenotype is present in about 10% of Fabry disease patients with LVH in their cohort (11/105; 10%) and it was associated with an increased risk of cardiovascular events such as heart failure hospitalization, sustained ventricular tachycardia, ischemic stroke, and all-cause mortality.[12] Consequently, it is increasingly being understood that the LVAA phenotype in Fabry disease is a high risk marker that may require intensive therapeutic approaches, as was seen in our patient.
Click here to view the entire CMR on CloudCMR.
References
- Desnick RJ, Brady R, Barranger J, Collins AJ, Germain DP, Goldman M, Grabowski G, Packman S, Wilcox WR. Fabry disease, an under-recognized multisystemic disorder: Expert recommendations for diagnosis, management, and enzyme replacement therapy. Ann Intern Med. 2003; 138:338-346.
- Meikle PJ, Hopwood JJ, Clague AE, Carey WF. Prevalence of lysosomal storage disorders. JAMA: the journal of the American Medical Association. 1999; 281:249-254.
- Kampmann C, Baehner F, Whybra C, et al. Cardiac manifestations of Anderson-Fabry disease in heterozygous females. J Am Coll Cardiol 2002;40: 1668–74.
- Mehta A, Clarke JT, Giugliani R, Elliott P, Linhart A, Beck M, Sunder-Plassmann G, Investigators FOS. Natural course of fabry disease: Changing pattern of causes of death in FOS – fabry outcome survey. J Med Genet. 2009; 46:548-552.
- Kampmann C, Baehner F, Whybra C, et al. Cardiac manifestations of Anderson-Fabry disease in heterozygous females. J Am Coll Cardiol 2002;40: 1668–74.
- Chimenti C, Pieroni M, Morgante E, et al. Prevalence of Fabry disease in female patients with late-onset hypertrophic cardiomyopathy. Circulation 2004; 110:1047–53.
- Waldek S, Patel MR, Banikazemi M, Lemay R, Lee P. Life expectancy and cause of death in males and females with Fabry disease: findings from the Fabry registry. Genet Med 2009; 11:790–6.
- Birnie DH, Sauer WH, Bogun F, et al. HRS expert consensus statement on the diagnosis and management of arrhythmias associated with cardiac sarcoidosis. Heart Rhythm 2014; 11:1305–23.
- Messroghli DR, Moon JC, Ferreira VM, Grosse-Wortmann L, He T,Kellman P, Mascherbauer J, Nezafat R, Salerno M, Schelbert EB, et al. Clinical recommendations for cardiovascular magnetic resonance mapping of T1, T2, T2* and extracellular volume: a consensus statement by the Society for Cardiovascular Magnetic Resonance (SCMR) endorsed by the European Association for cardiovascular Imaging (EACVI). J Cardiovasc Magn Reson. 2017; 19:75. doi: 10.1186/s12968-017-0389-8.
- Sado DM, White SK, Piechnik SK, Banypersad SM, Treibel T, Captur G, Fontana M, Maestrini V, Flett AS, Robson MD, et al. Identifcation and assessment of Anderson-fabry disease by cardiovascular magnetic resonance noncontrast myocardial T1 mapping. Circ Cardiovasc Imaging. 2013; 6:392–398. doi: 10.1161/CIRCIMAGING.112.000070.
- Karur GR, Robison S, Iwanochko RM, Morel CF, Crean AM, Thavendiranathan P, Nguyen ET, Mathur S, Wasim S, Hanneman K. Use of myocardial T1 mapping at 3.0 T to differentiate Anderson-fabry disease from hypertrophic cardiomyopathy. Radiology. 2018; 288:398–406. doi: 10.1148/radiol.2018172613.
- Nordin S, Kozor R, Medina-Menacho K, Abdel-Gadir A, Baig S, Sado DM, Lobascio I, Murphy E, Lachmann RH, Mehta A, et al. Proposed stages of myocardial phenotype development in fabry disease. JACC Cardiovasc Imaging. 2019;12(8 pt 2):1673–1683. doi: 10.1016/j.jcmg.2018.03.020 74.
Case prepared by:
Associate Professor Rebecca Kozor
Royal North Shore Hospital and University of Sydney, Sydney, Australia