


Jose Vicente Monmeneu Menadas MD PhD, Pilar García-Gonzalez MD PhD, Alicia M. Maceira Gonzalez MD PhD
ASCIRES Biomedical Group Valencia, Spain
Clinical History:
A 43-year-old male patient with unremarkable past medical history was admitted to the Infectious Diseases unit for suspected respiratory infection by severe acute respiratory syndrome coronavirus 2 (SARS-CoV-2) resulting in coronavirus disease 2019 (COVID-19). On arrival, the patient reported fever that started 14 days before and persisted for 10 days, dry cough and hemoptoic sputum. Nasopharyngeal swabs were immediately obtained, confirming SARS-CoV-2 by a positive reverse transcriptase PCR. Viral serology by immunochromatography performed 15 days after onset of symptoms yielded IgM-negative and IgG-positive for SARS-CoV-2.
On admission, he had a heart rate of 77 bpm, blood pressure 135/80 mmHg, temperature 36.8ºC and SpO2 91%. Chest X-ray (Image 1) revealed a diffuse interstitial pattern with opacities in both lungs. ECG (Image 2) showed sinus rhythm with minimal ST segment elevation and extensive repolarization abnormalities.
Urgent portable transthoracic echocardiogram showed left ventricle of normal dimensions with mild hypertrophy and overall hypokinesia with LVEF 50-55%. A mild hyperrefringence pattern was also observed at the lateral wall of the left ventricle.
Laboratory results were: high-sensitivity troponin T curve of 29-24-24-18-15 ng/L (<14 ng/L), NT-proBNP 456 pg/mL (<125 pg/mL), ferritin 1060 ng/mL (< 300 ng/mL), D-dimer 790 ng/mL (< 500 ng/mL), C-reactive protein 14 mg/L (<10 mg/L), leukocyte count 4.03 x 10˄3/μL (> 4.8 x 10˄3/μL), 83% neutrophils (< 70%) and lymphocytes 0.42 x 10˄3/μL (> 0.9 x 10˄3/μL), 10.4% (>19%).
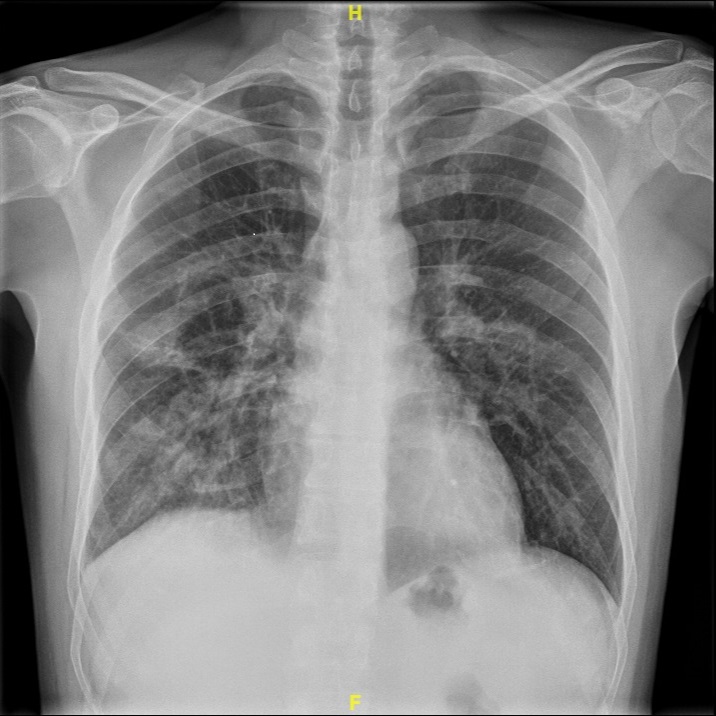
Image 1: Chest x-ray with diffuse interstitial pattern with opacities in both lungs
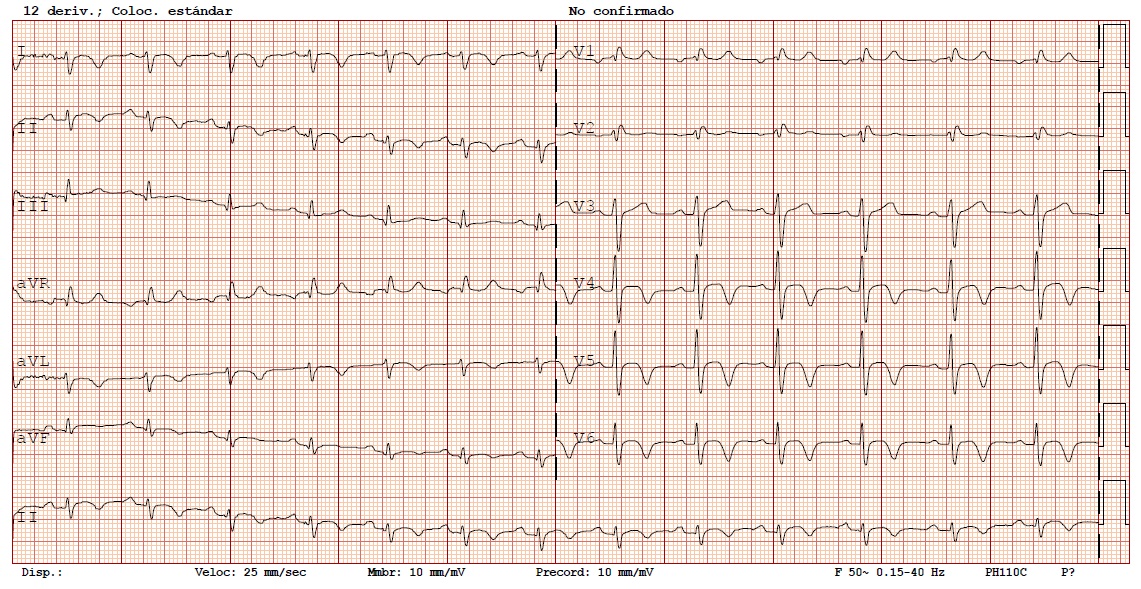
Image 2: Twelve lead electrocardiogram with sinus rhythm with minimal ST segment elevation and extensive repolarization abnormalities.
CMR Findings:
CMR at 1.5 T was performed 15 days after the onset of symptoms, right pulmonary consolidation along with associated pleural effusion was seen in the multislice anatomical sequences (Image 3). Left ventricle of normal volume with concentric hypertrophy and mild depressed systolic function (LVEF 53%) secondary to diffuse hypokinesia was observed (Movies 1-2). Global longitudinal strain was decreased (Image 4), with -14.5 in 2-chamber cine and -11.4 in 4-chamber cine. Myocardial edema with predominant subepicardial pattern was seen in the lateral, anterior, inferior and apical segments on T2 short tau inversion recovery (Image 5) and T2 mapping sequences (Image 6), determining wall pseudo-hypertrophy. Pericardial edema without associated effusion was also observed. Native T1 and extracellular volume (ECV) both were increased in relation to the acute inflammatory process (Image 7, top: native T1, bottom: ECV). Late gadolinium sequences showed extensive, patchy intramyocardial/subepicardial enhancement affecting the entire lateral, anterior, inferior, and apical septal walls and the pericardium (Image 8). Myocardial tissue characterization by CMR at presentation summarized in Image 9.
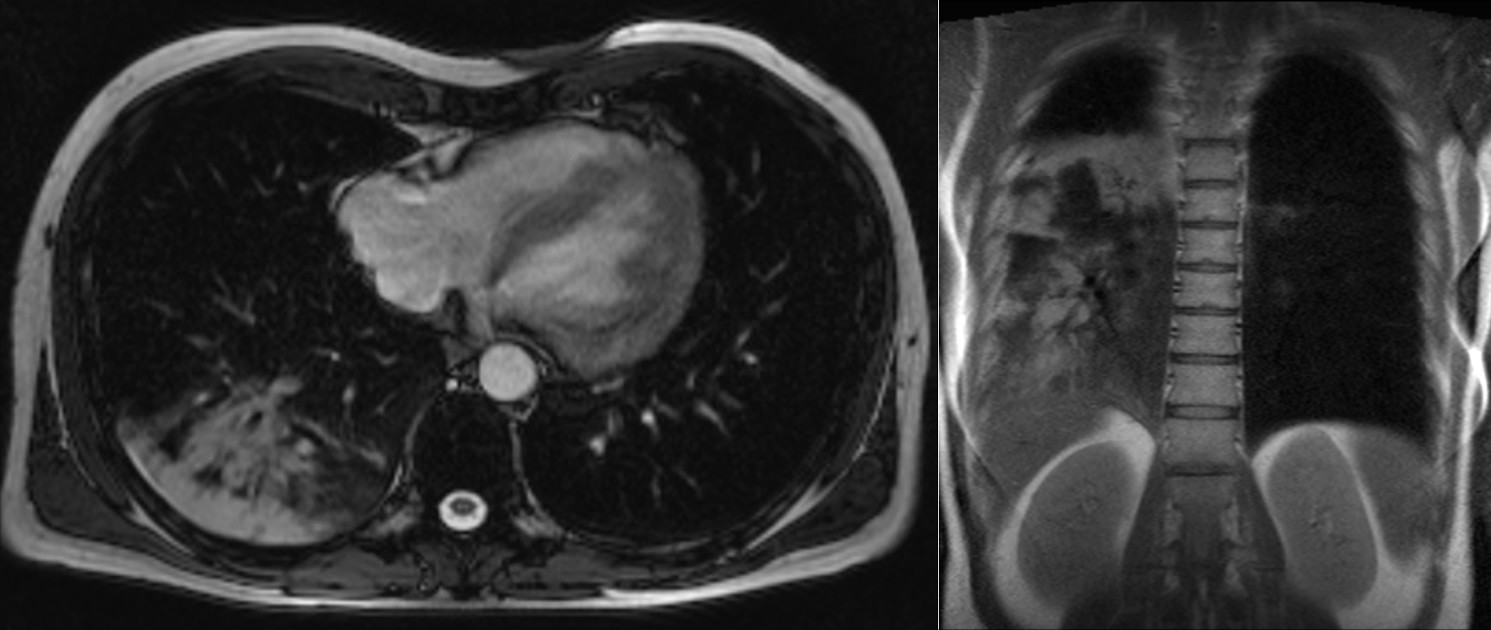
Image 3: Axial and coronal single shot SSFP images with right pulmonary consolidation along with associated pleural effusion.
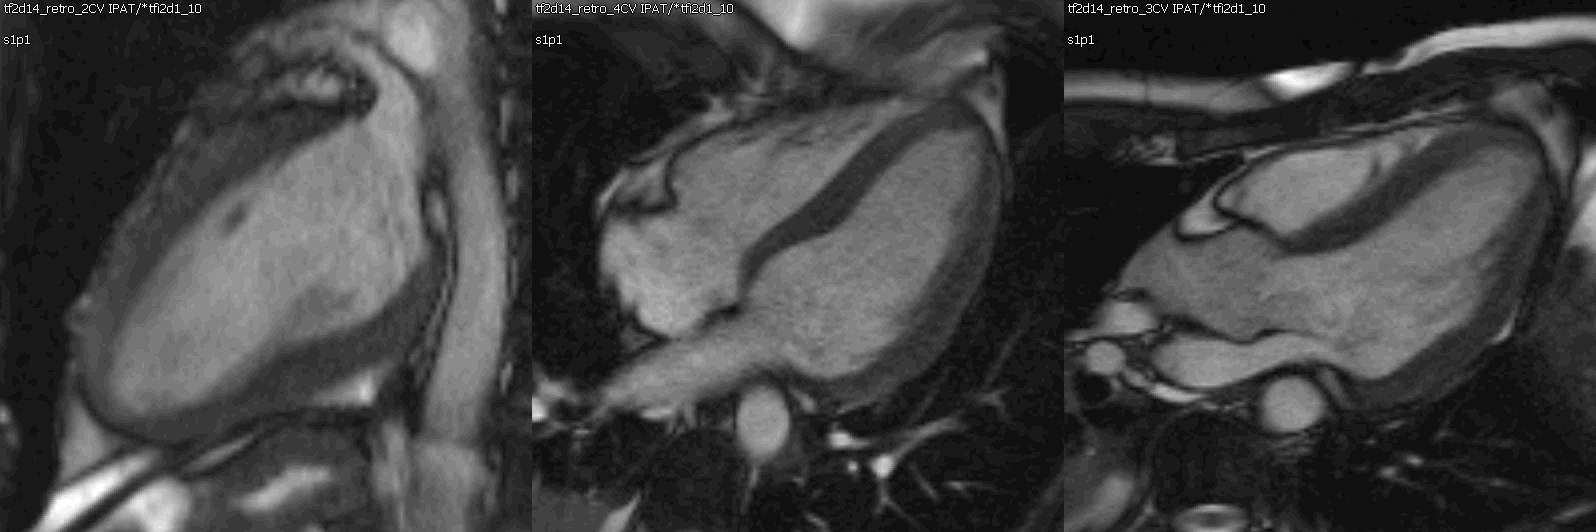
Movie 1: Cine SSFP left ventricle two chamber, four chamber, and three chamber showing mild concentric hypertrophy and mildly decreased systolic function.
Movie 2: Cine SSFP short axis stack showing mild concentric hypertrophy and mildly decreased systolic function.
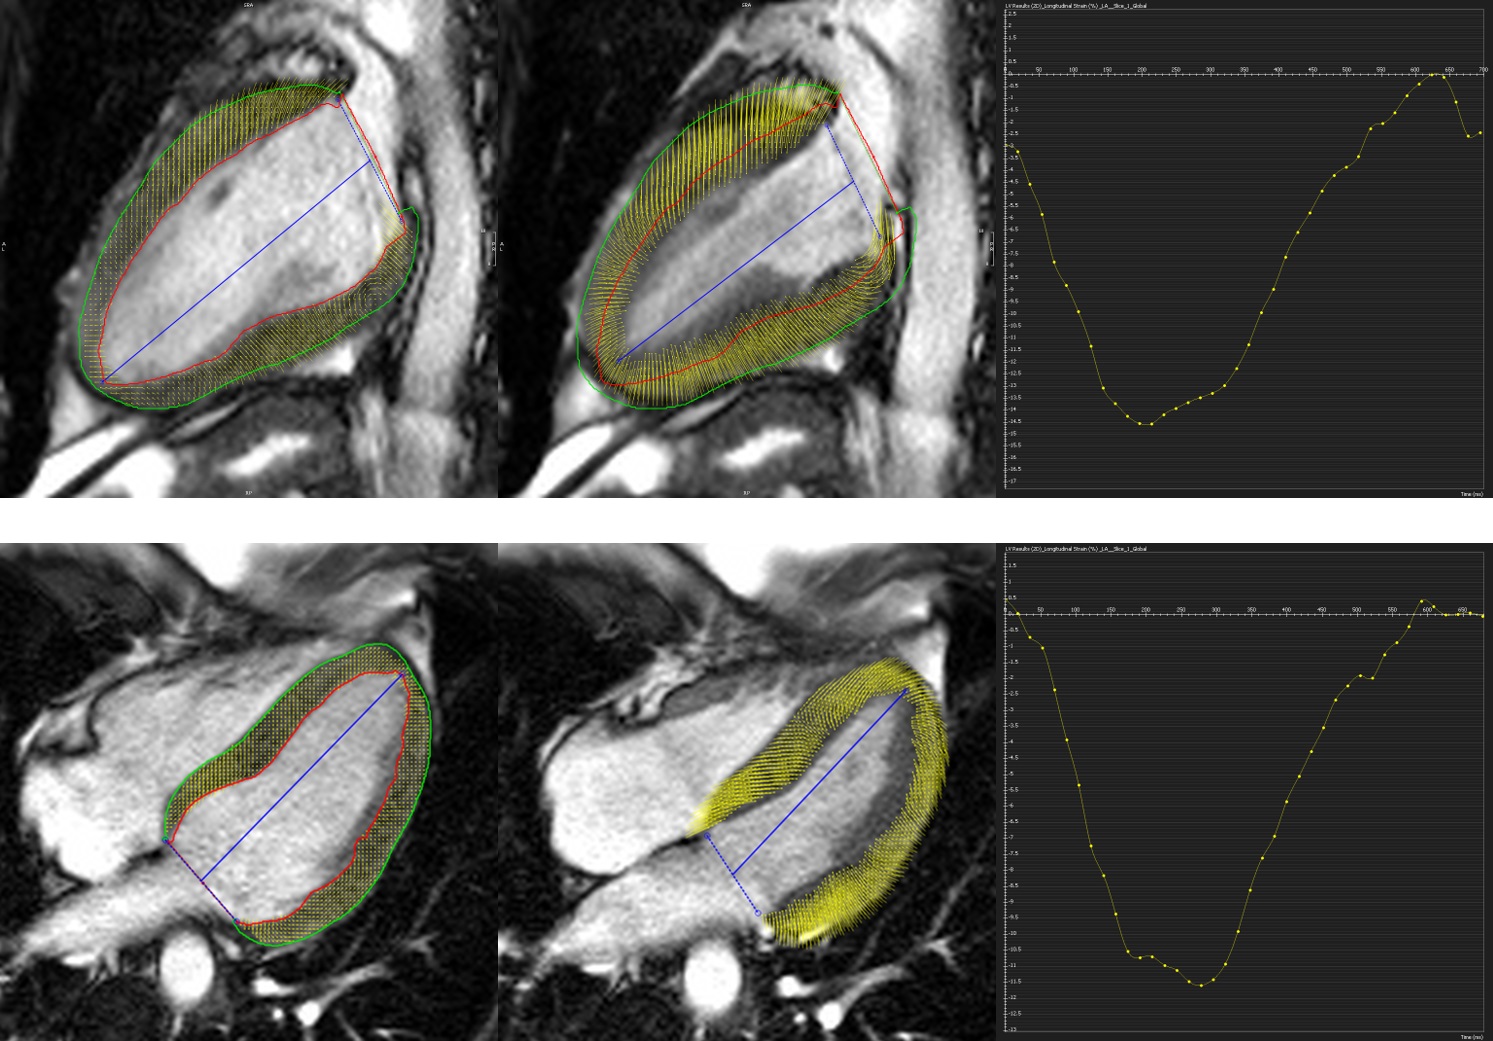
Image 4: Two chamber and four chamber cine SSFP at end-diastole and end-systole with global longitudinal strain.
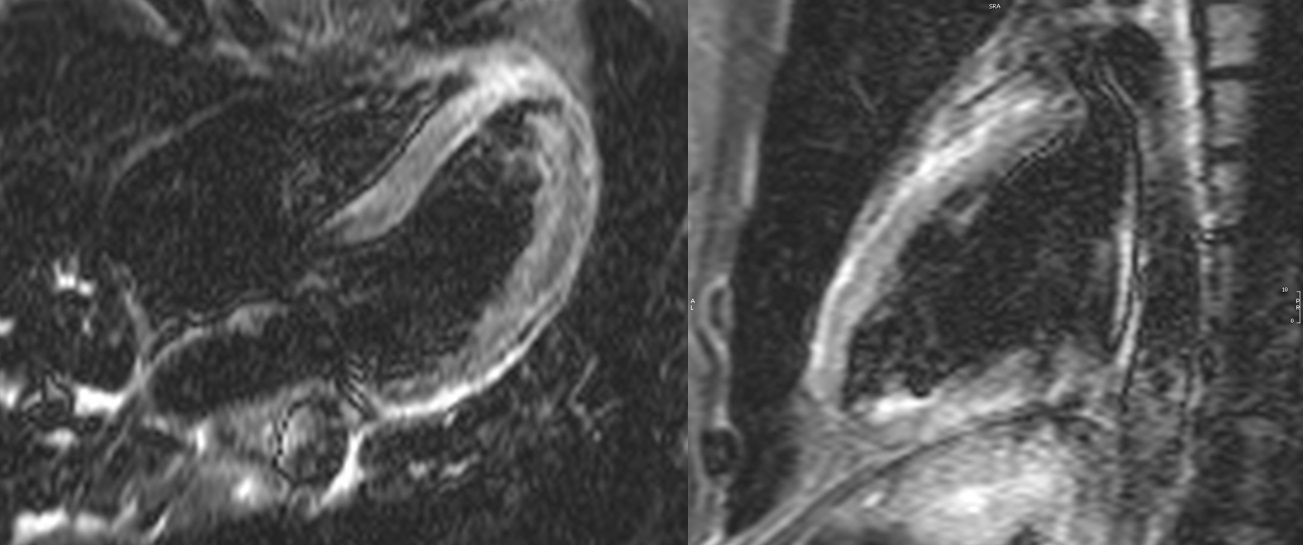
Image 5: Short tau inversion recovery (STIR) four chamber and two chamber images with hyperintensity of the subepicardial lateral, anterior, inferior and apical segments indicating myocardial edema.
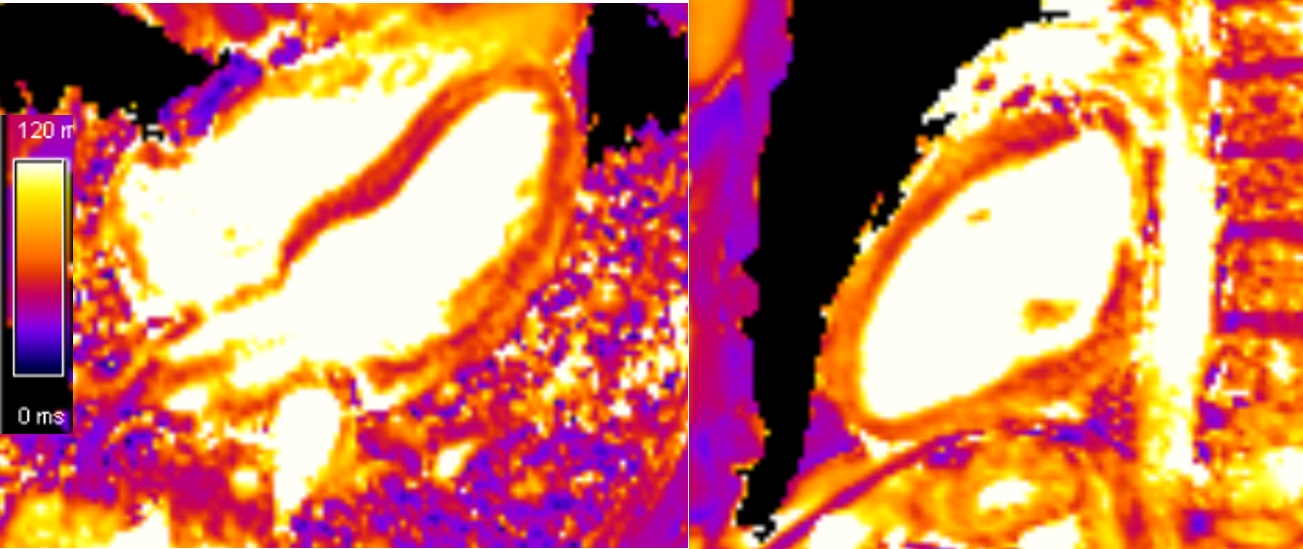
Image 6: T2 mapping four chamber and two chamber sequences with an average of 60 ms, mid-septum of 53 ms, and lateral wall of 67 ms, reference value 50 ms.
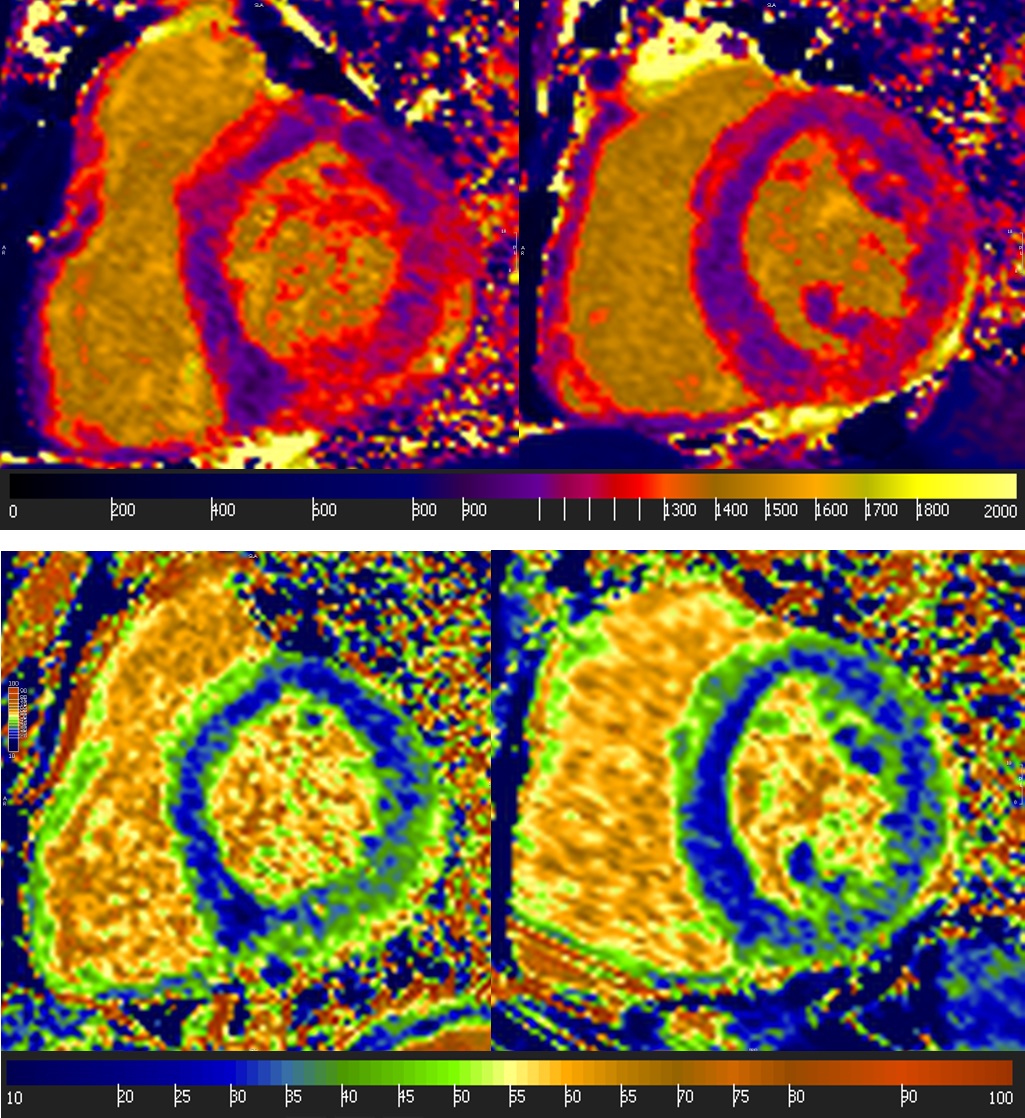
Image 7: Short axis native T1 mapping and extracellular volume (ECV). Top: Native T1: average 1110 ms, mid-septum 1047 ms, lateral wall 1204 ms, reference value 950 ms. Bottom: ECV: average 33%, mid-septum 29%, lateral wall 39%, reference value 24%.
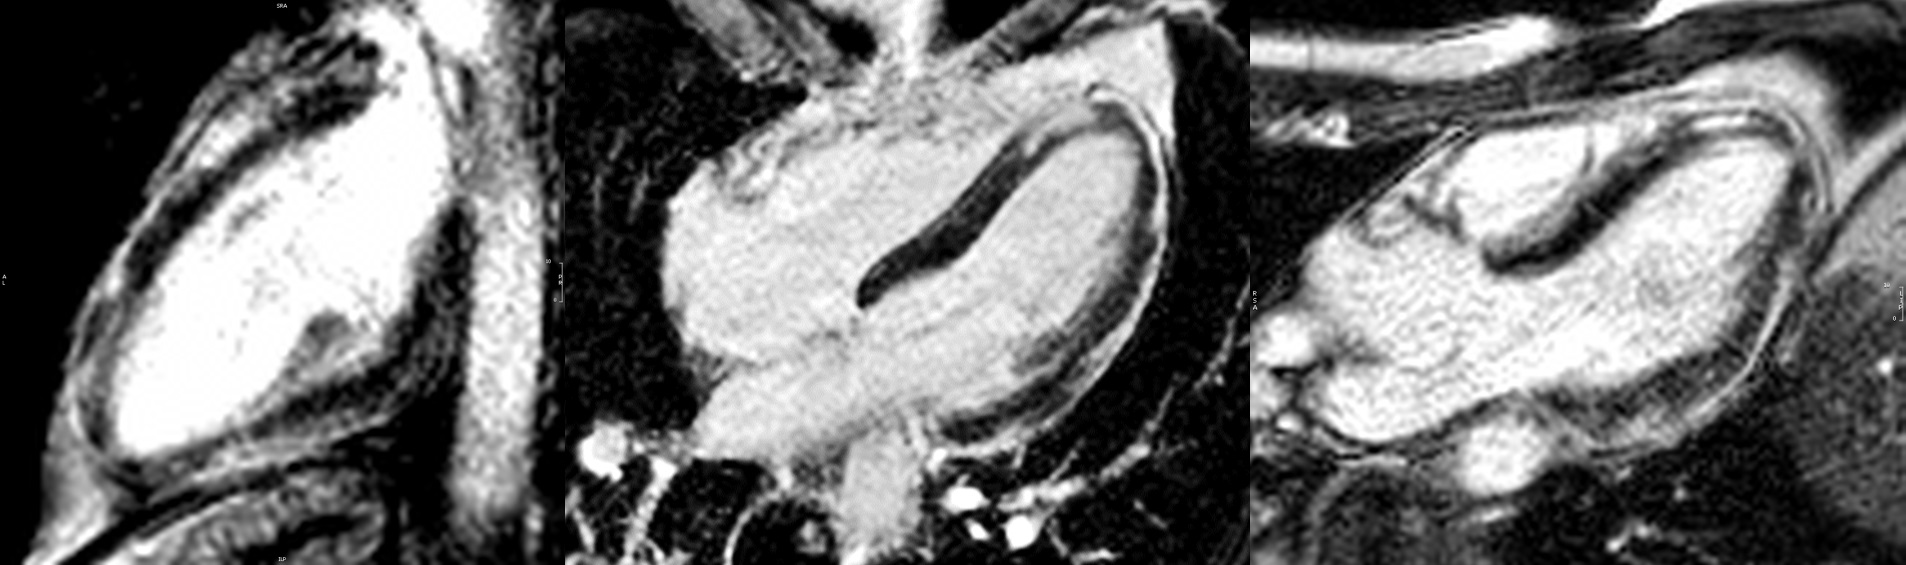
Image 8: Two chamber, four chamber, and three chamber myocardial late gadolinium enhancement images show extensive, patchy mid to epicardial late gadolinium enhancement affecting the basal to apical lateral, anterior, inferior walls and apical septal wall including the pericardium.
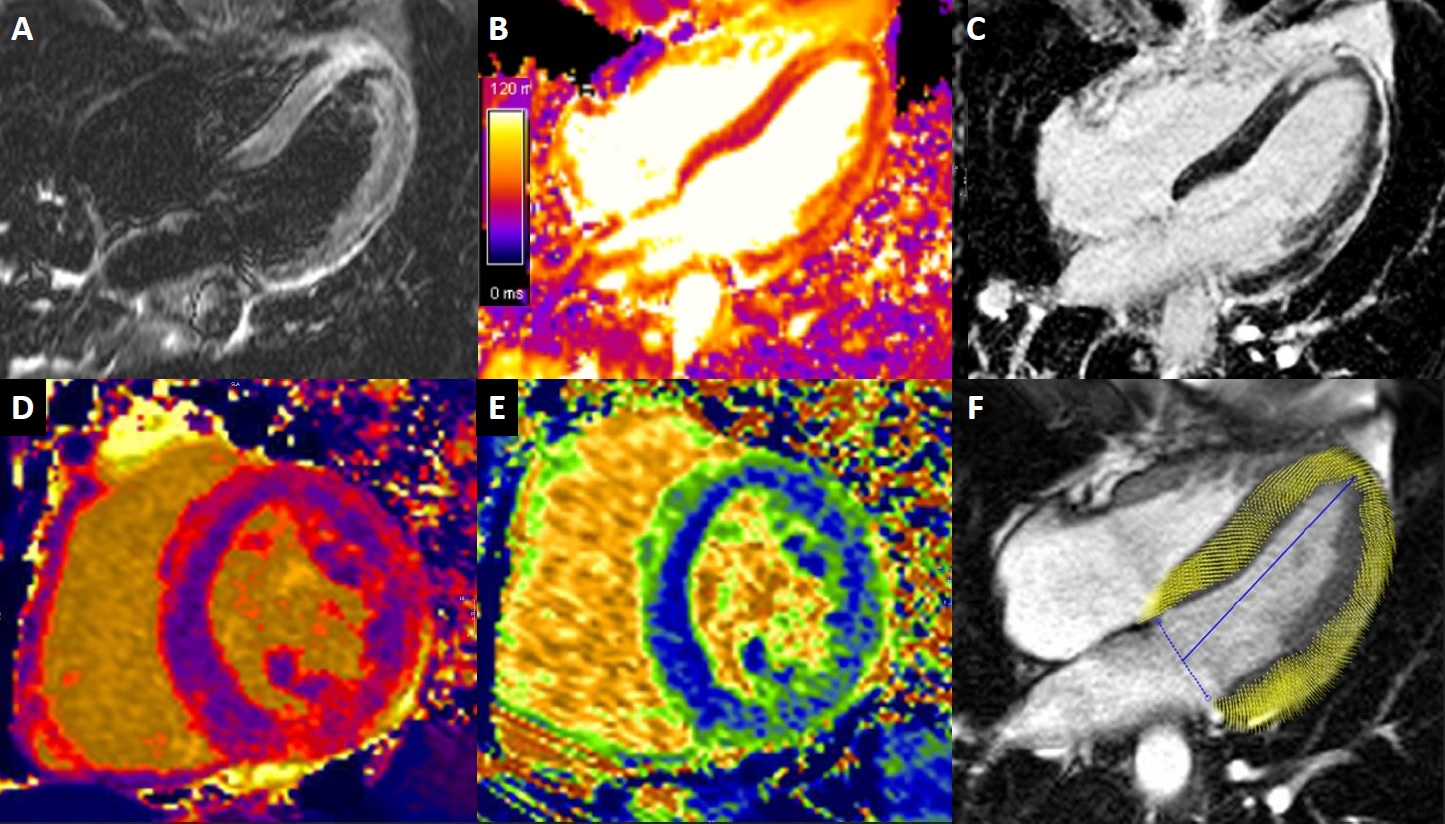
Image 9. Myocardial tissue characterization summary. A. Four chamber STIR. B. Four chamber T2 map. C. Four chamber late gadolinium enhancement. D. Short axis native T1 map. E. Short axis ECV map. F. Four chamber strain end-systole.
One month later a follow-up CMR was performed, showing less edema in T2 mapping sequences, lower values of native T1 and ECV, and late gadolinium enhancement was significantly diminished as shown in Image 10.
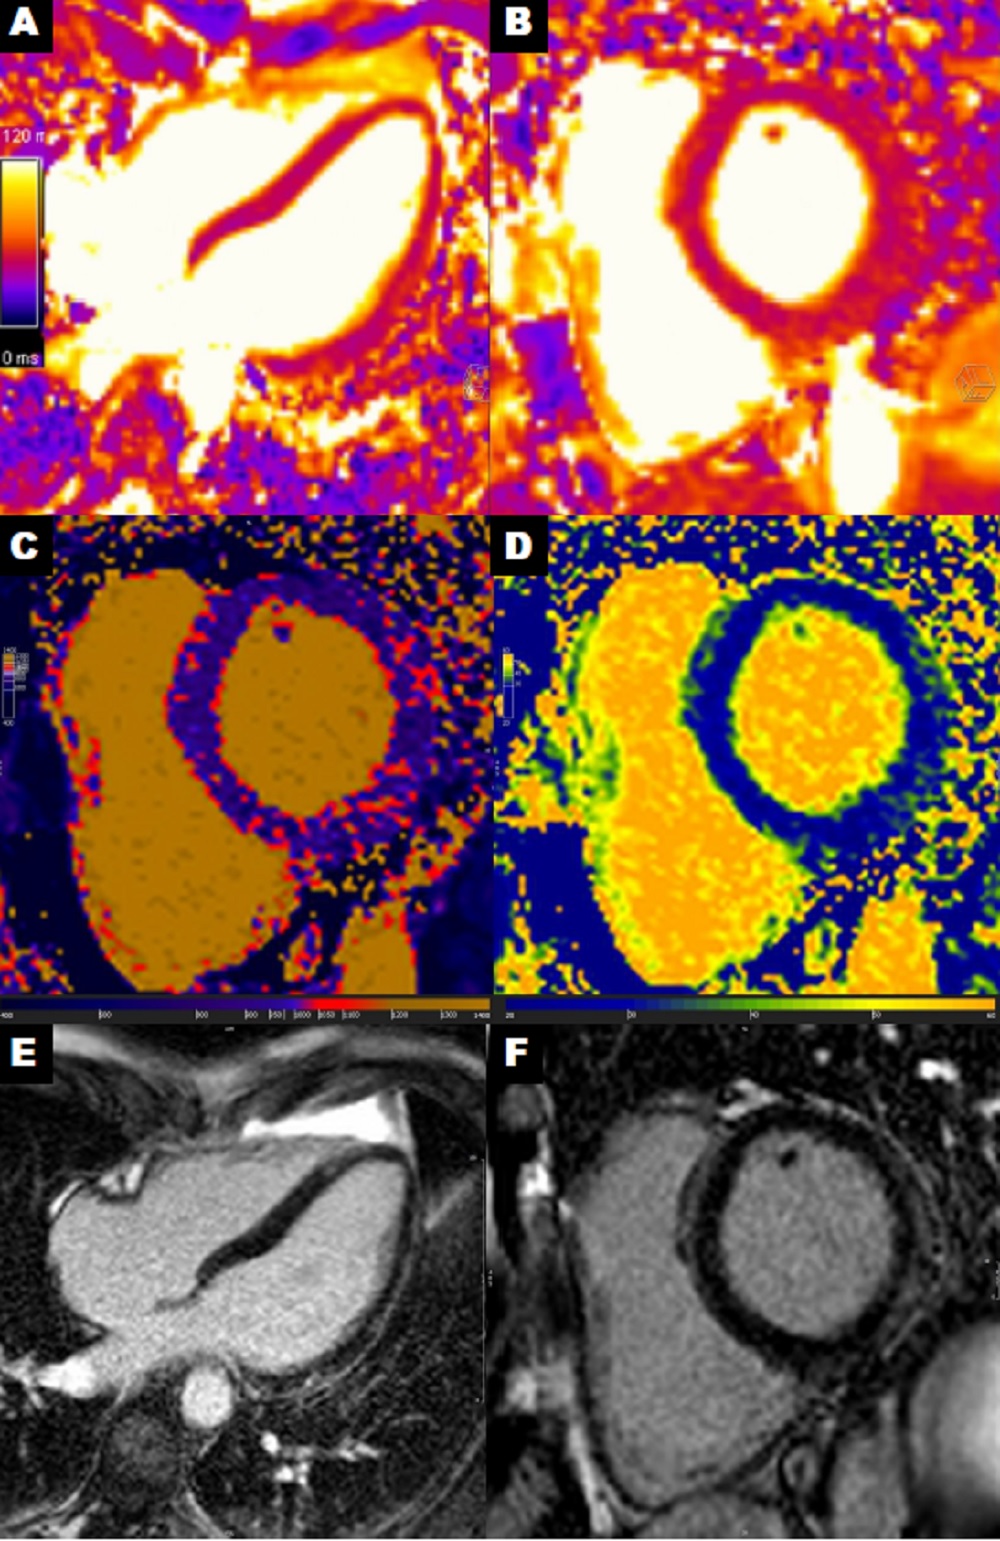
Image 10: Myocardial tissue characterization summary from the one month follow-up CMR. A-B. T2 mapping four chamber and short axis with average myocardial value of 47 ms, mid-septum of 44 ms, and lateral wall of 51 ms. C-D. Native T1 and ECV short axis with average myocardial native T1 value of 988 ms, mid-septum 972 ms, and lateral wall 1030 ms. Average myocardial ECV 28%, mid-septum 25%, and lateral wall 31%. E-F. Late gadolinium enhancement four chamber and short axis with improved lateral wall enhancement compared to the previous CMR.
Conclusions:
The patient was discharged 8 days after hospital admission. Since then he has been asymptomatic with good clinical evolution and with significant improvement in CMR alterations in a control performed one month later. This case provides further evidence obtained with CMR of extensive myocardial inflammatory involvement secondary to SARS-CoV-2 infection that has been described in some patients but the mechanism of which is currently not fully understood.
Case Prepared by:
Jason N. Johnson, MD MHS
Editor, COVID-19 Case Collection
Le Bonheur Children’s Hospital, University of Tennessee Health Science Center